Even before the last flakes of winter 2026 had fallen, predictions for winter 2027 already made headlines due to the probable return of the most-hyped atmospheric oscillation out there: El Niño.

Hyperbolized monikers like “Super” and “Godzilla” are already running rampant across the web and in mountain town conversations throughout the Sierra. So is this real or hype? What impacts could this have on summer and winter across the Tahoe Sierra? And what is El Niño anyway?
El Niño Basics
El Niño is part of a natural, periodic warming of the eastern and central equatorial Pacific Ocean waters that occurs every 2-7 years as part of the ENSO (El Niño Southern Oscillation). Officially, sea surface temperatures between 5°N and 5°S latitude and 120°W to 170°W longitude (also known as the Niño 3.4 region) must surpass 0.5°C over the long term mean by 3 or more months. El Niño isn’t a raging storm or any single weather event, just anomalous warming of oceanic waters over an extended period. While El Niño and its causes are well known in the scientific community, there is still extensive ongoing research to help better understand what factors like oceanic circulations, trade wind slackening, Kelvin waves, climate change, etc. help set the stage for the phenomenon’s periodic return and iterative strength.
Moderate to strong El Niños can have significant impacts on the atmosphere in the tropics and beyond. Because the ocean and the atmosphere are so closely linked–the ocean is a direct source of atmospheric heat and water vapor– an upward shift in sea surface temperatures for an extended period, as occurs during El Niño, causes large-scale changes in the atmosphere in the Niño 3.4 region and beyond. At the most basic level, higher sea surface temperatures increase the potential energy of the atmosphere, promoting storm development in places that typically don’t experience it (eastern and central equatorial Pacific), while areas climatologically favored for convective storm development and rainfall tend to go dry (Western Pacific and Australia).
El Niño Teleconnections and California
The local changes to weather over the Pacific wrought by El Niño don’t stick to their own neighborhood. Much like ripples in a pond extend out across the water’s surface, so too do the atmospheric ripples caused by the shift in atmospheric pressure, temperature, and subsequent storm formation over the central and eastern Pacific. Connections between a persistent weather pattern in one part of the world affecting weather patterns elsewhere are called teleconnections. And it’s these teleconnections from El Niño that can have the greatest impact on the Sierra, primarily during the winter (Dec-Mar).
One major teleconnection with impacts on California during moderate to strong El Niño is a strengthening of the subtropical jet stream (STJ), the high altitude, high velocity steering winds between 35-40k ft. that circle the globe around 20°-30°N. Storms typically ride and develop along these currents which also serve as thermal boundaries between air masses. Jet streams garner their power from steep temperature gradients in the atmosphere. In midwinter, the difference between the constant warmth of the tropics and the deepening cold of the mid to upper latitudes reaches its zenith, seasonally enhancing the strength of the STJ.
During El Niño, the STJ strengthens even more than normal in response to a greater thermal gradient between the tropics and higher latitudes, especially across the Pacific and North America. This raises the likelihood of the winter storm track digging further south into CA and the SW along the enhanced STJ, increasing the odds of more frequent storms coming ashore into Central and Southern California.
To illustrate the point of an increased temperature gradient in the Eastern Pacific as a result of El Niño, here’s a comparison of 2m temperatures across the Pacific Basin, one from mean climatology, the other from the near record El Niño in the winter of 97-98′. For reference, the peak temperature anomaly in the Niño 3.4 region during the 97-98′ event was 2.4°C, a very strong event.
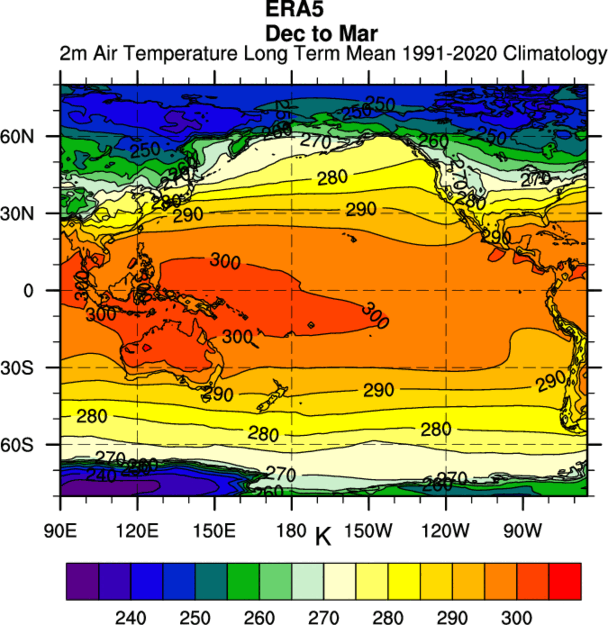
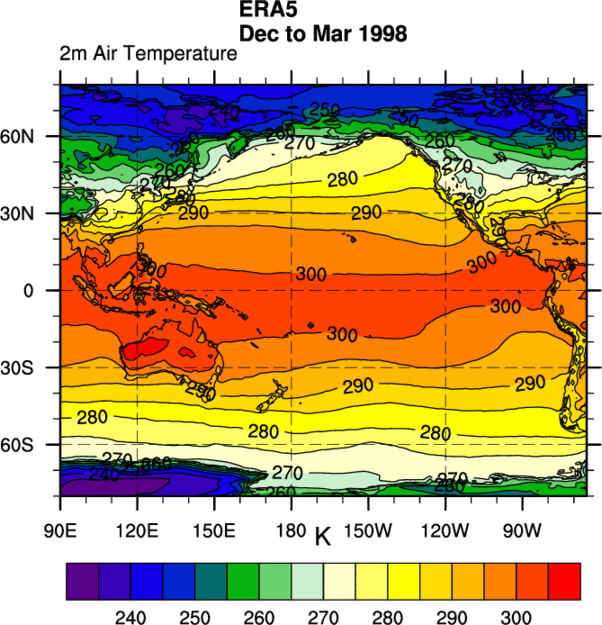
Notice the tongue of 300K temps stretching all the way across the tropical Pacific into Central America in winter 98′. This surge of heat also created a greater north-south temperature gradient between the tropical Pacific and the mid latitudes to the north.
The greater temperature gradient near the surface extended upward throughout the atmosphere, enhancing the strength of the STJ. Below is data showing the typical mean strength of the STJ from Dec-Mar, followed by the actual strength of the STJ from Dec 97′-Mar 98′, and the strength of the anomaly observed for that season.
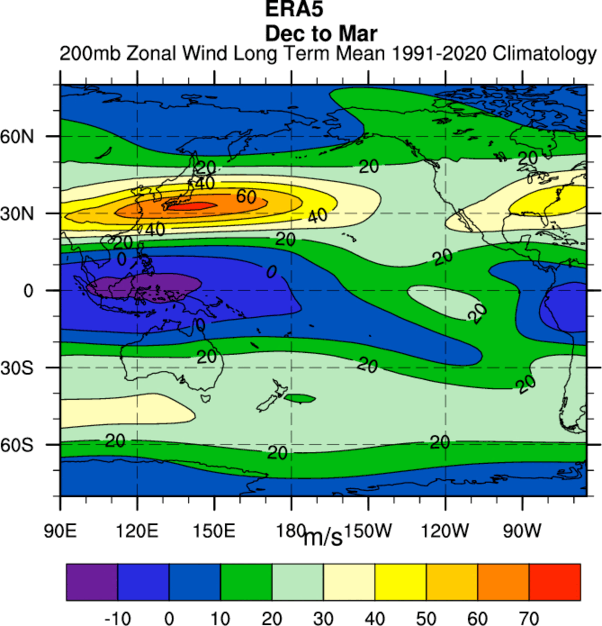
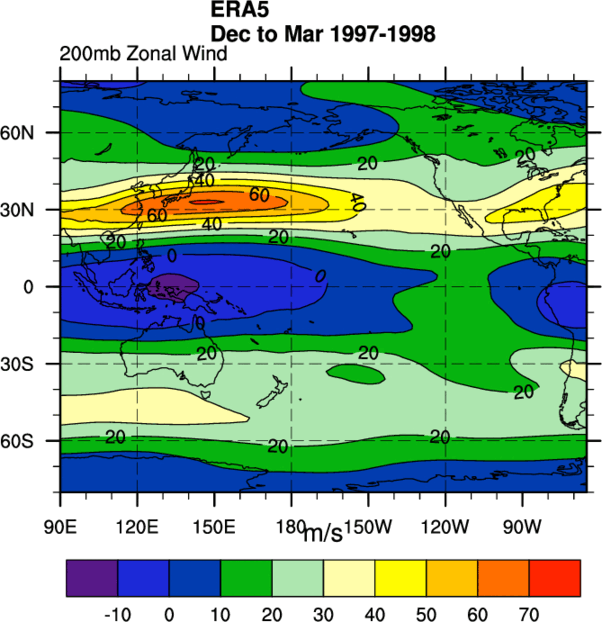
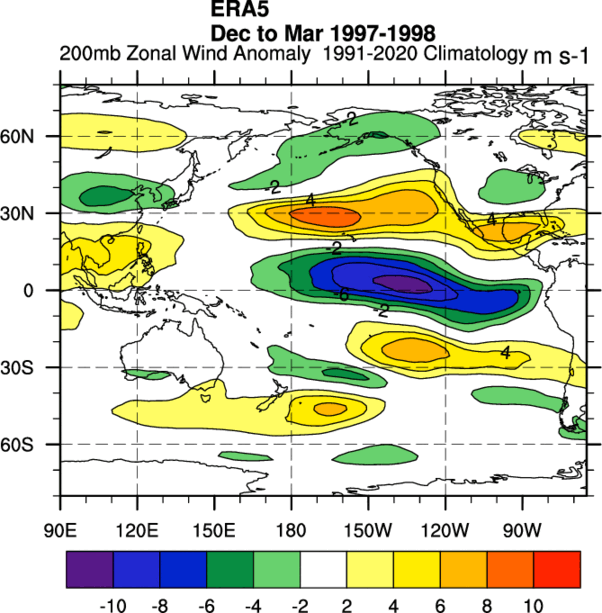
In response to the greater thermal gradient across the Pacific Basin, the STJ responded with increased intensity and range across the Pacific and into CA. Also worth noting is that the elongated STJ slowed down near CA, placing CA in a region of upper level conditions favorable for storm formation for prolonged periods during the winter months.
While an enhanced STJ promoting a more active storm track into CA is a classic El Niño teleconnection, the phenomenon comes in many strengths and flavors, all of which can greatly affect the local impacts from year to year. Should anomalous SSTs occur further west in the Pacific, impacts to CA can change drastically. (The 97-98′ and 82-83′ strong El Niños produced significantly above average winters in the Sierra, while the 2015-2016 event, still quite strong, ended up being more of a yawn for the Sierra and snowpack.)
El Niño: not the only player
ENSO is also not the only teleconnection that affects weather in the Tahoe Sierra. Other teleconnections across the globe have their own constructive or destructive influence on the impacts of El Niño. While ENSO is significant, it’s far from the only predictive signal for winter precip. Further complicating the scene, the atmosphere is now significantly warmer than it was even just a decade ago. In fact, the earth is twice as warm as it was in 1998. The additional warmth in both the tropics and the mid and upper latitudes will have significant–and not yet entirely understood–impacts on El Niño and its teleconnections going forward. It’s a complicated picture.
What is increasingly clear for the Sierra is that a warmer atmosphere will generally produce warmer storms with higher snow levels. If SSTs in the Pacific are warmer than average, that heat energy will be transferred into the atmosphere, creating generally warmer storms with a greater capacity for heavy precip. Tahoe could receive above average precipitation in a strong El Niño event, but much of that might fall as rain, especially at mid to lower elevations in the Basin (6000-8000’). Even without El Niño, winter 2026 ended up being an example of such a scenario with a snow drought for elevations below 7000′, while higher terrain, especially above 9000′ ended up with snowfall totals closer to normal.
Current conditions and El Niño forecast for winter 2027
With the basics of El Niño and how it can impact the Sierra covered, where do things stand now? And what strength and flavor of El Niño could form this winter?
Currently, SSTs across the Pacific Basin are already well above average. There’s even an ongoing marine heatwave across the E Pacific that’s been building for the past few months, completely unrelated to ENSO, which may have played a significant role in the cool, wet April and series of weekly storms throughout this past spring.
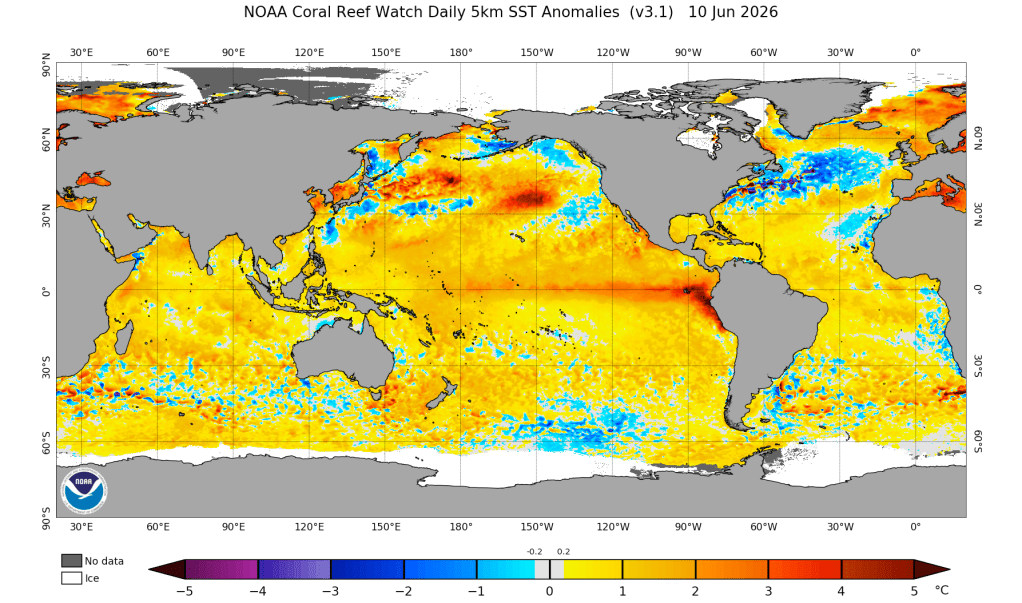
Signs of an emerging El Niño are already taking shape as waters along the Ecuadorian and Peruvian coasts are 3-5°C above average and a tongue of 2-3°C waters is emerging along the equator, extending westward out to around 120°W and even beyond. The classic “light sabre” of anomalously warm waters extending from South America out into the Pacific is already coming into view. Will this continue developing throughout the summer and into the fall?
Forecasts for El Niño’s development are in strong agreement for a significant event, as noted in the latest ECMWF (Euro) ensemble member forecasts.

The blue dashed line and pixelated red plume indicate actual observed and projected anomalies to date. SSTs are already climbing in a steep, upward trajectory. As we move out in time, the strength of the event is less certain with greater spread in the models, but by late fall all model members are between 2-3°C, a significant event. There are no members not predicting an El Niño, while quite a few go out to 3-4°C, which would be a very intense event. What’s also significant about this forecast is that it shows a “relative” Niño anomaly, representing how significant the SST anomaly is in the context of current conditions that are already warmer than average due to long term background warming. To learn more about the relative indices, check out this NWS/NOAA explainer.
Forecasts from the Climate Prediction Center show this near certainty of El Niño quite strikingly in their most recent June ENSO probabilities and strength forecasts. Between May and June, CPC forecasts leaned even harder into both the near certainty of El Niño for the coming fall and winter, and the likelihood of a very strong event.
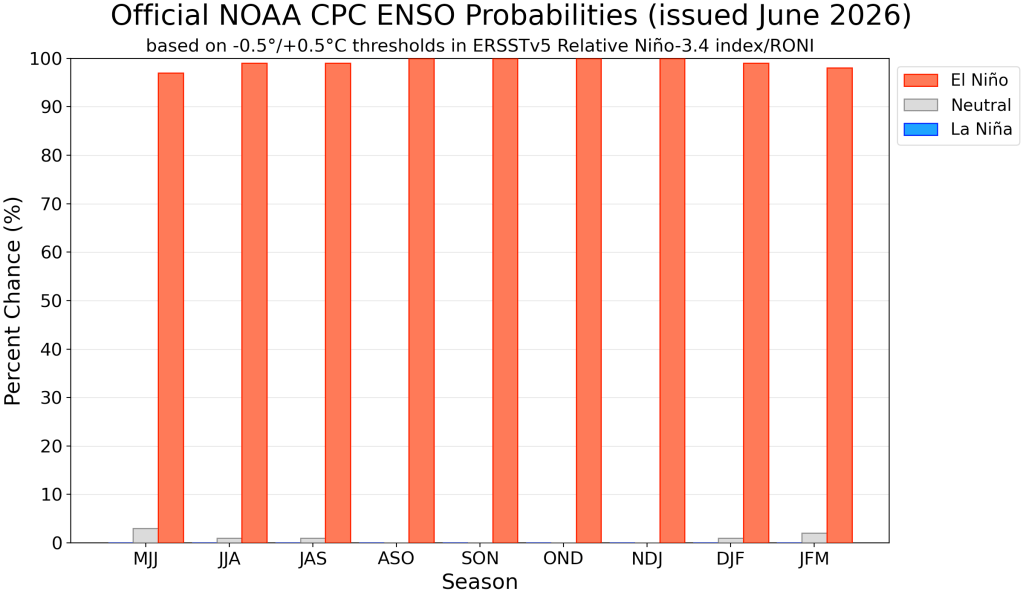
Like the Euro ensembles above and current SST observations, El Niño is nearly certain for the remainder of the coming year and into next winter. Seasonal and subseasonal probability forecasts with such high probabilities are exceedingly rare.
The latest June intensity forecasts for El Niño have also trended heavily towards a very strong event since the May advisory.


The darker bar at the top of is the likelihood of a very strong event, greater than 2.0°C. Starting in the late fall (October, November, December) chances of a very strong event have doubled since the May advisory! Probability forecasts in May were ~30% and have since climbed to more than 60% and continue into the November – December – January time frame. Forecasts in May were impressive, but this month’s update is even more eyebrow raising. It’s not often that seasonal forecasts this far out are in such alignment and continue trending heavily towards such an extreme outcome.
What does all this mean for the coming season in Tahoe? It’s impossible to say exactly, but with what we know, strong odds for a very strong El Niño do increase the odds of a few things happening.
For the coming summer, warmer than average waters over the tropical Pacific will increase the amount of energy available for tropical cyclone development. This will likely lead to a more active than normal East Pacific hurricane season with more atmospheric “fuel” available for more intense storms. In recent weeks, a few tropical storms have already formed off the SW coast of Mexico in the area of the current, marine heatwave. As waters warm and expand northward with the developing El Niño, they will merge with the current marine heatwave, creating even more favorable conditions for stronger and more numerous tropical storms and hurricanes.
What does this have to do with CA? Moisture from these systems could get pulled northward into CA and the desert SW, increasing the chances for afternoon thunderstorms in late summer and early fall. But the flavor of thunderstorms is a big unknown and won’t be clear until days or even hours before they form. Wet storms could bring beneficial rains, helping to temper fire season concerns. Dry storms could ignite vegetation, complicating fire concerns. The widespread fires in CA in late summer of 2020 were largely ignited by dry lightning strikes caused by similar (non El Niño-related) transport of moist, tropical, low and mid level flow into California, causing high-based, dry thunderstorms.
For winter, exact outcomes of a strong El Niño are also impossible to say. While models now overwhelmingly favor a very strong event, forecasters won’t have an idea of if/how the teleconnections set up with respect to the subtropical jet (STJ) until later in the fall and early winter. Historically, odds tend to favor a more active and wetter than normal winter for the Sierra with the strong El Niño acting as the dominant teleconnection affecting regional weather patterns. The current forecast trend towards a very strong event adds more confidence to a wet and active winter forecast.
Across Tahoe a key factor will be just how much cold air is able to mix in to any given system. The Tahoe region already sits right along the rain/snow line, and with more heat in atmosphere, snow levels will likely continue to be higher more often than not. Rain up to 7000′ is now a fairly common occurrence. But should the storm track align such that cold air from the Gulf of Alaska phases with enhanced subtropical moisture, lower snow levels and heavy snow would result. This far in advance, discussion of details is nothing more than speculation.
Godzilla may not rise out of the sea later this year, but active and impactful weather later this summer and into next winter look increasingly likely for California and the Sierra. El Niño hyperbole isn’t just on the internet and in mountain town chatter, it’s also appearing in the data.
